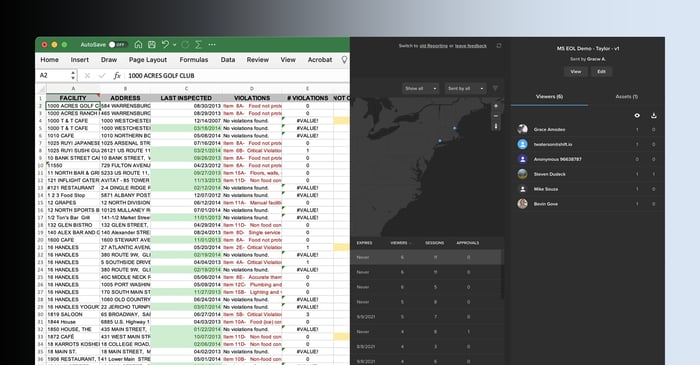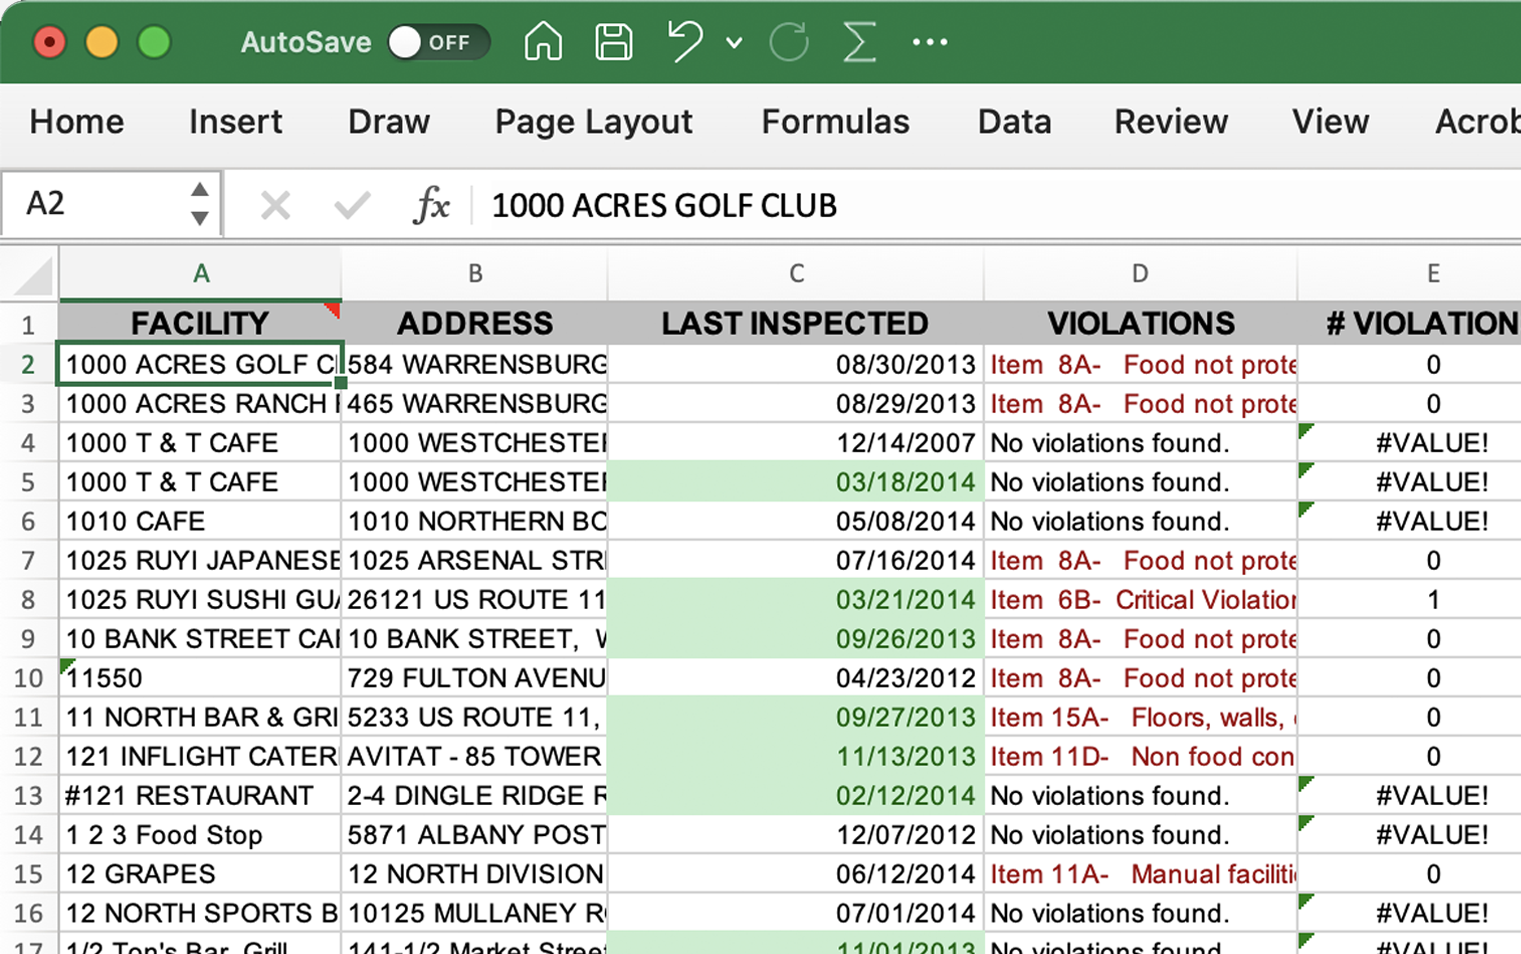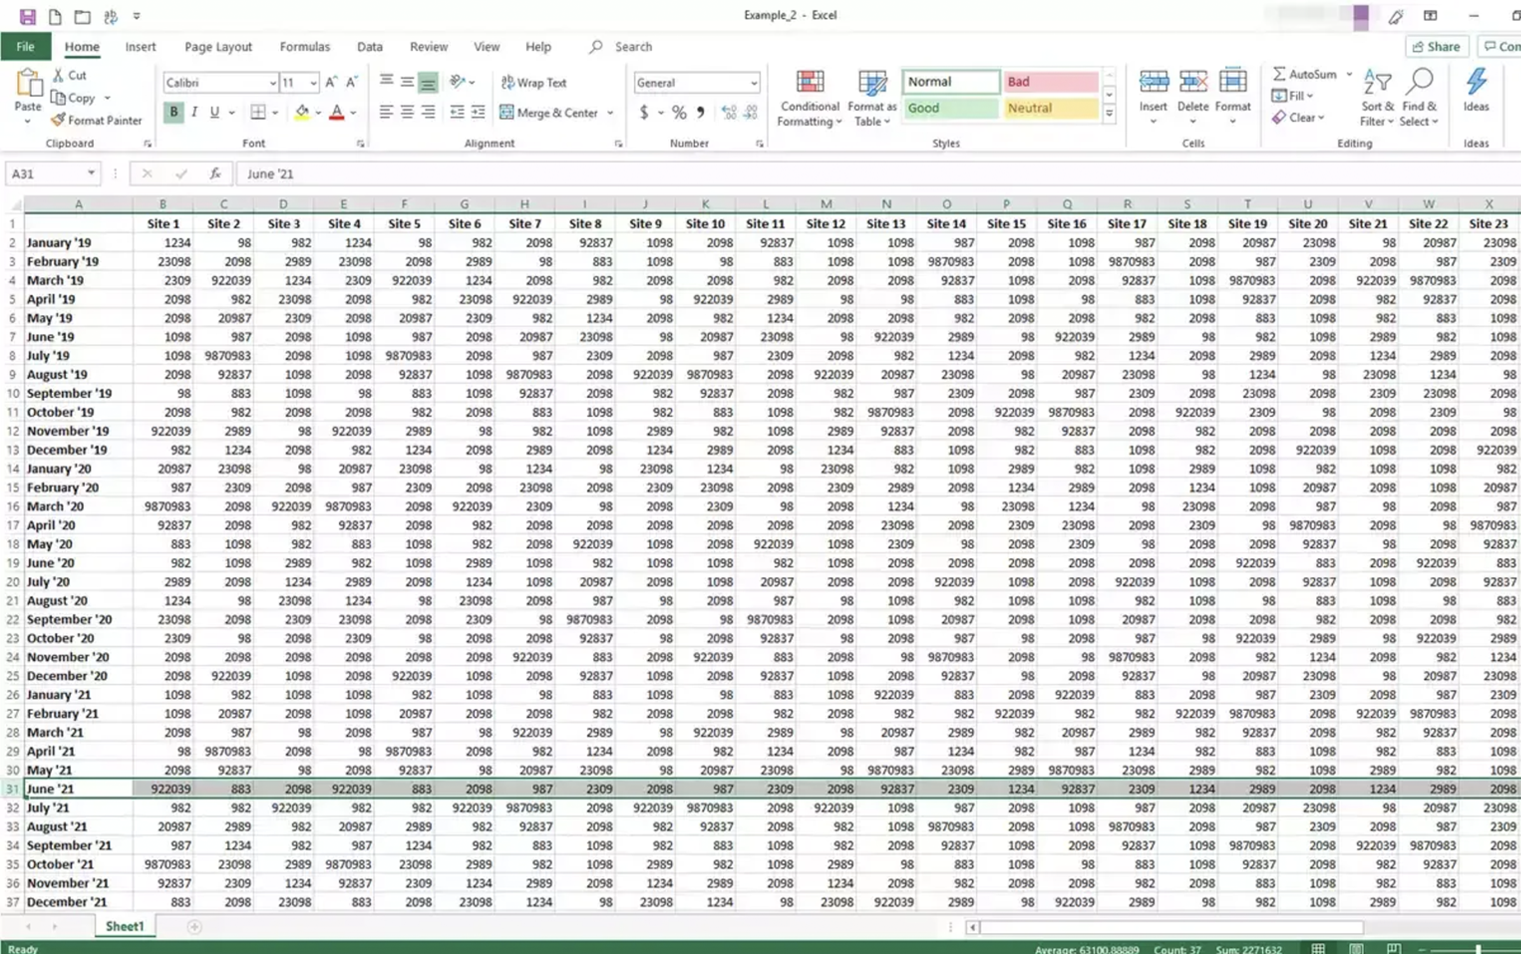
Love it or hate it, one of the most inescapable software tools in all of TV, film and video production is the ubiquitous spreadsheet. Studios, crews, agencies and teams of all types and sizes track their schedules, gear, assignments, call sheets, and locations using the infinite rows, columns and cells of a trusty pivot table.
But when it comes to the media assets that are vital to delivering productions for your business, it’s time to lift the spell of the spreadsheet and shine the light on real insights instead.
Fact #1: Spreadsheets are notorious for errors
From the age-old report that 88% of spreadsheets contain errors, to more recent studies showing that 20% of genetics scientific papers contain errors caused by spreadsheets, it’s commonly known that trusting your important stats to Excel is far from reliable. Even if the data itself isn’t complicated, tiny mistakes – whether from repetitive manual user input, imports of incorrectly formatted data into existing files, or simple miscalculations in formulas – can all make spreadsheets prone to errors.

Fact #2: Spreadsheets require expertise
Unless you and your stakeholders are professional data wranglers, spreadsheets can be difficult to analyze. Why? Because on one hand, rows upon rows of raw data are hard to gain insights from without the necessary filtering, graphing, and sorting it takes to really discern their importance. And on the other hand, although many software tools have visualization features built-in, it’s too easy for anyone to use them to interpret data incorrectly.

Whether you send out a spreadsheet nightly, weekly, or quarterly, it’s outdated the moment you hit “export.”
Fact #3: Spreadsheets are stale
How often do you have to update a dashboard, create a report, or provide analytics on your shared media files? Whether you send out a spreadsheet nightly, weekly, or quarterly, it’s outdated the moment you hit “export.” And that means the knowledge your stakeholders gain from the data may no longer apply – introducing potentially costly delays, and making important decisions too late. Without real-time data, your perfectly formatted, color-coded spreadsheets are simply not actionable.
A better way to track your content
There’s no trick to tracking your shared media assets with Insights, the media analytics engine within MediaSilo.

Insights is accurate.
There’s no mistaking the accuracy of analytics on your project, assets, and viewers; all the data comes directly from your MediaSilo system, not a separate software tool. How much is the file being viewed? Who is viewing the file? When are these people viewing the file? And how often are files being viewed vs. downloaded? No matter how granular you need the data, you never need to create a separate tab, formula, or file. From an entire project, right down to a single asset.

Insights is confusion-free.
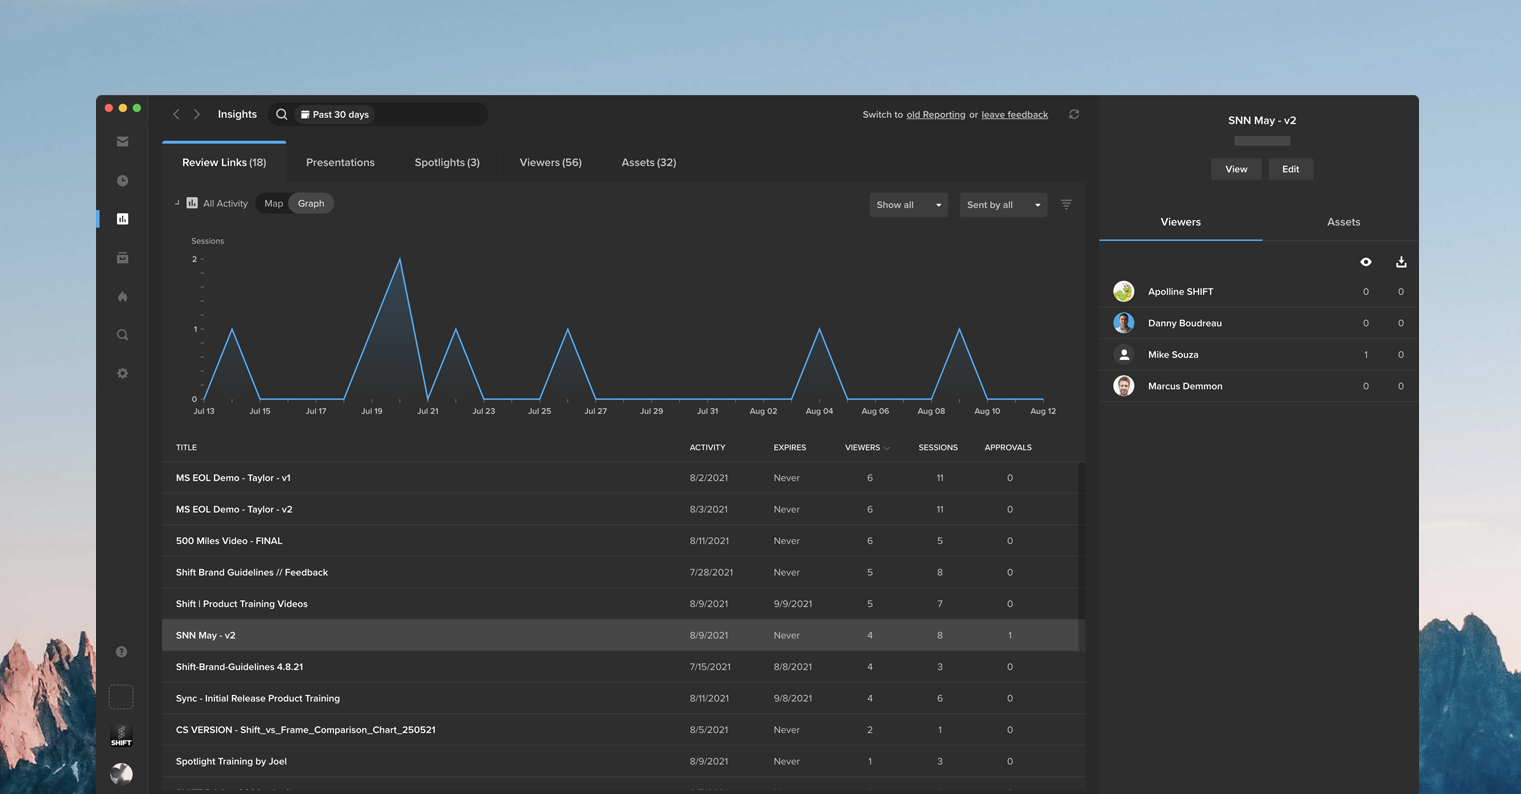
The Insights dashboard is designed to answer questions about your assets, regardless of how you ask them. Want to see where your videos are being viewed? No need to create a graph from scratch — the IP address map will show you. Wonder when a video was viewed the most? Look at the timeline view. Happy that twenty people watched the clip, but you want to know which twenty? See them for yourself. Insights gives you easy access to visualize your data, with tools that can’t be tricked.
Insights is actionable.
One of the most important uses of your data will be in helping your business make quick decisions about your media assets — and better ones, too. You can gain intel, for instance, about how far into clips a viewer gets before viewership drops off, and have your team make changes to the content. Even more immediately, if you notice content activity in locations you don’t recognize, you can pivot your security on the fly by editing expiration dates, password protection, or presentation and link settings in the dashboard. With Insights, media security is like a crystal ball in your hands.
Break the spell
Media assets are the backbone of a studio’s or agency’s intellectual property. So when it comes to quickly tracking, analyzing, and reporting on them, it’s important to avoid the demons that plague spreadsheets. Make your sharing, reviewing and usage data more accurate, more understandable, and more actionable – instantly – using Insights in MediaSilo.


